


The landscape of digital advertising has undergone a massive paradigm shift in recent years. For a long time, marketers lived in an era of abundant, highly granular data. You could look at an ads dashboard, see exactly which click led to which purchase, and optimize your campaigns accordingly. Today, that pixel-perfect reality is fading.
As tracking becomes more restricted, marketers are drowning in fragmented data but starving for true clarity. Relying solely on in-platform tracking is no longer a viable way to measure the true health of a business. This is where the Marketing Efficiency Ratio (MER) comes in. Often referred to as the holy grail of modern marketing metrics, MER cuts through the noise of siloed dashboards to reveal the actual financial health of your marketing efforts.
If you are looking to scale your brand profitably, understanding this metric is no longer optional—it is a baseline requirement.
What is the Marketing Efficiency Ratio (MER)?
At its core, the Marketing Efficiency Ratio (MER) is a high-level metric used to evaluate the overall effectiveness of your marketing efforts. Rather than getting bogged down by which specific platform gets credit for a sale, MER looks at the macro relationship between your marketing investments and your total sales.
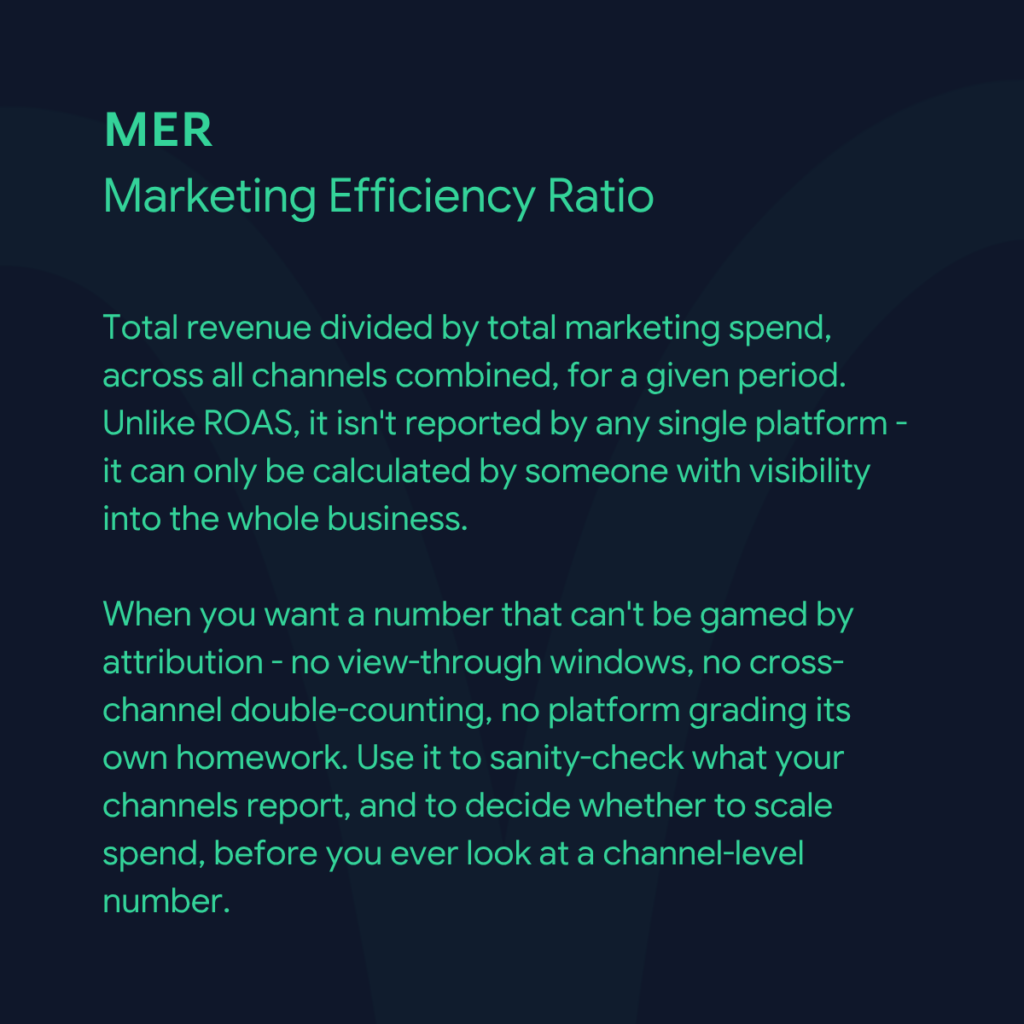
In simple terms, MER is the measurement of total revenue vs total ad spend.
Also commonly known as your blended return on ad spend, MER looks at the business as a single, living ecosystem. If you spend money on Meta ads, TikTok ads, and Google Search, MER does not care which dashboard claims the conversion. It only cares about how much money left your bank account to pay for ads, and how much total money came back into your bank account as revenue.
Adopting the Marketing Efficiency Ratio MER as a primary KPI forces teams to take a holistic approach to marketing measurement. Instead of individual media buyers fighting for attribution credit, the entire team focuses on the overarching goal: driving total business growth efficiently.
The Formula: How to Calculate Blended ROAS
For business owners and marketers looking to standardize their reporting, learning how to calculate blended roas (or MER) is incredibly straightforward. You don’t need complex attribution software or advanced coding skills.
The MER Formula:MER = Total Revenue / Total Ad Spend
Let’s look at a practical example. Suppose your e-commerce brand spends the following in a given month:
Meta Ads: $20,000
Google Ads: $15,000
TikTok Ads: $5,000
Total Ad Spend: $40,000
In that same month, your Shopify store generates $160,000 in total revenue (including paid, organic, direct, and email traffic).
Your MER calculation would be: $160,000 / $40,000 = 4.0
This means for every $1 you spent on advertising across all channels, your business generated $4 in total revenue. By using this metric, your roi calculation becomes grounded in actual cash flow rather than platform-reported estimates, giving your finance and marketing teams a shared language.
Why MER Matters More Than Ever
The sudden rise in the popularity of MER isn’t just a trend; it is a necessary reaction to massive industry changes.
Overcoming the Loss of Pixel Tracking
The impact of privacy updates on digital attribution—most notably Apple’s iOS 14.5 update, the gradual deprecation of third-party cookies, and stricter data privacy laws—has permanently altered the digital marketing landscape. Ad platforms like Meta and Google have lost a significant amount of visibility into user behavior across the web. As a result, in-platform ROAS is frequently underreported or wildly delayed. If you base your scaling decisions purely on what Ads Manager tells you, you might unnecessarily turn off highly profitable campaigns.
Moving Beyond Bottom-Up Attribution
Historically, marketers relied on top-down vs bottom-up attribution models. Bottom-up models (like last-click or multi-touch attribution) try to piece together the individual customer journey from the ground up. While this was great in 2018, today’s fractured data landscape means bottom-up models are riddled with missing links.
Conversely, MER represents a top-down approach. By focusing on the total advertising impact on gross sales, you are no longer relying on a broken chain of cookies to tell you if your marketing is working.
Uncovering the Halo Effect
Marketing channels do not operate in a vacuum. A user might see a TikTok ad, close the app, google your brand three days later, click an organic search link, sign up for your newsletter, and finally purchase through an email promo. Who gets the credit?
By relying on omnichannel marketing performance metrics like MER, you acknowledge the “halo effect” of your advertising. Paid media drives brand awareness, which in turn lifts organic search volume, direct traffic, and email signups. MER is the most accurate way of measuring ecosystem revenue growth because it accounts for the undeniable fact that all marketing channels assist one another.
Financial Precision: MER vs. Bottom-Line Metrics
While MER is an exceptional tool for measuring the efficiency of your top-line revenue, it is vital to understand where it fits within your broader financial reporting.
Many founders confuse marketing efficiency with true profitability. To run a healthy business, you must understand the difference between contribution margin and blended efficiency.
Marketing Efficiency Ratio (MER): Tells you how efficiently your ad dollars are generating top-line revenue. (Revenue / Ad Spend).
Contribution Margin: Tells you how much actual profit remains after you subtract your Cost of Goods Sold (COGS), shipping, fulfillment, payment processing fees, and ad spend.
MER does not factor in your product costs or overhead. Therefore, a high MER doesn’t automatically mean you are profitable if your profit margins are razor-thin. For true success in optimizing ecommerce profitability through blended metrics, you should track your MER alongside your contribution margin. Establishing a “Target MER” based on your unique break-even contribution margin is the secret to scaling without going broke.
Establishing Baselines: Average Advertising Efficiency Benchmarks by Industry
A common question among marketers is: “What is a good MER?”
The truth is, a “good” ratio depends entirely on your profit margins, business model, and customer lifetime value (LTV). However, it is still helpful to look at average advertising efficiency benchmarks by industry to see where you stand:
High-Margin E-commerce (Apparel, Cosmetics, Supplements): Because COGS are typically lower (often 15% to 30% of the retail price), these brands can survive on a lower MER. An MER of 3.0 to 4.0 is generally considered healthy and highly scalable.
Low-Margin Retail & Dropshipping (Electronics, Third-Party Goods): With much higher product costs, these businesses require higher marketing efficiency to break even. An MER of 5.0 to 7.0 is often necessary to remain profitable.
SaaS & Subscription Services: These businesses often focus heavily on Customer Lifetime Value rather than immediate first-purchase profitability. They might operate comfortably with an MER of 1.0 or 1.5 in the short term, knowing that recurring revenue will yield massive profits over the next 12 to 24 months.
Ultimately, your target MER should be uniquely tailored to your own unit economics.
Strategic Benefits of Managing by MER
Adopting a top-down metric transforms the way a marketing team operates day-to-day. Here are some of the most significant strategic advantages.
1. Confidence in Scaling Ad Spend
One of the most terrifying things for a media buyer is increasing daily budgets, only to watch platform ROAS plummet. However, platform ROAS often drops because the attribution window takes time to catch up, or the platform struggles to claim the assisted conversions occurring via organic search.
When you focus on MER, scaling advertising spend across multiple channels becomes much less intimidating. If you double your Meta ad spend and Meta’s reported ROAS drops, but your daily total store revenue doubles and your MER remains stable, you know the ads are actually working. You can continue to scale with confidence.
2. Reducing Customer Acquisition Costs
While MER is a revenue-focused metric, it directly impacts your acquisition costs. By tracking your blended metrics, you can easily calculate your blended Cost Per Acquisition (bCPA)—which is Total Ad Spend divided by Total New Customers.
Focusing on the macro picture is instrumental in reducing customer acquisition costs with efficiency metrics. You might find that increasing spend on a high-funnel awareness channel (like YouTube) initially looks expensive in isolation, but ultimately drives down your blended CPA by making your bottom-funnel Google search ads convert at a much higher rate.
3. A Stepping Stone to Advanced Measurement
MER is a powerful gateway to more sophisticated tracking methodologies, such as media mix modeling for small businesses. Media Mix Modeling (MMM) uses statistical analysis to estimate the impact of various marketing tactics on sales.
Historically, MMM was only accessible to Fortune 500 companies with massive data science teams. Today, by diligently tracking daily ad spend by channel alongside daily total revenue (the core components of MER), even small to mid-sized businesses can use lightweight MMM software or spreadsheet regressions to uncover exactly how much revenue a specific channel is incrementally driving.
Actionable Tips for Integrating MER into Your Strategy
To make the most of your blended metrics, don’t just check your MER once a month. Integrate it into your daily operations with these actionable tips:
Calculate Your Break-Even MER: Work with your finance team to determine your true break-even point. If your break-even MER is 2.5, you know that hitting a 3.0 means you are generating profit. Use this target as your North Star.
Track Daily and Weekly Trends: Create a simple spreadsheet tracking daily total ad spend, daily total revenue, and daily MER. Look for trends. Does your MER spike on weekends? Does an email newsletter blast artificially inflate your MER on Tuesdays? Understanding these rhythms helps you evaluate ad performance accurately.
Don’t Discard Platform Metrics Completely: MER tells you how your business is doing, but platform metrics tell you what to optimize. Continue using platform ROAS, Cost Per Click (CPC), and Click-Through Rate (CTR) as directional indicators to test creatives and audiences. Use MER to dictate your overall budget, and use platform metrics to guide your tactical execution.
Align Your Team: Ensure your email marketing team, organic social team, and paid media buyers are all looking at MER together. This eliminates internal friction and aligns everyone toward the common goal of driving total revenue growth.
The Bottom Line
The era of relying solely on perfectly tracked, in-platform attribution is over. As consumer journeys become more complex and privacy regulations grow stricter, brands must adapt to survive.
Embracing the Marketing Efficiency Ratio is the key to maintaining clarity in a murky data landscape. By zooming out and analyzing the big picture, you protect your business from platform volatility and attribution errors. You bridge the gap between marketing execution and financial reality.
Ultimately, tracking your blended return on ad spend allows you to make smarter, bolder, and more profitable decisions. Stop letting individual platforms grade their own homework. Look at your total investment, measure your total return, and use your MER to scale your brand sustainably into the future.
