


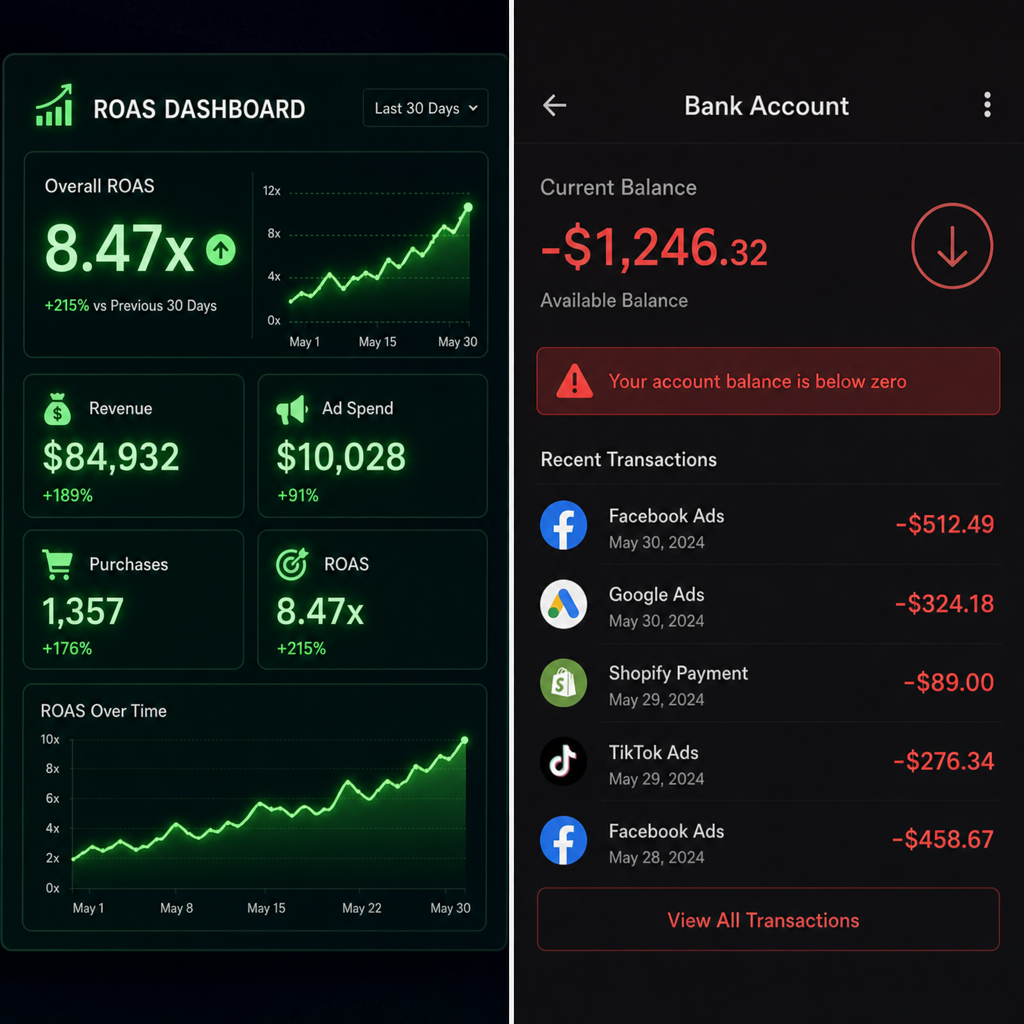
Imagine opening your advertising dashboard on a Monday morning. The numbers are glowing green. Your Google and Meta campaigns are reporting a 4.5x Return on Ad Spend. Naturally, you feel a surge of excitement. But then, at the end of the month, you check your bank account, and the reality hits hard: despite the spectacular dashboard metrics, your cash flow is stagnant, and your profit is practically non-existent.
Welcome to one of the most common and dangerous illusions in modern digital marketing.
For years, the e-commerce and digital marketing industries have worshipped at the altar of Return on Ad Spend. It was the ultimate metric of success. However, as advertising costs rise, competition increases, and tracking becomes more complex, a vital truth has emerged: you cannot pay your suppliers, your employees, or yourself with ROAS. You pay them with profit.
To build a sustainable, scalable business, you must shift your focus from front-end vanity metrics to true bottom-line health. This requires understanding the critical dynamic of contribution margin vs. ROAS.
In this comprehensive guide, we are going to tear down the traditional metrics playbook. We will explore why relying solely on ad platform data can tank your business, how to build a bulletproof e-commerce unit economics framework, and how to transition your media buying efforts toward optimizing for bottom-line profitability.
1. The Allure and Danger of ROAS
What is ROAS?
Return on Ad Spend (ROAS) is a simple marketing metric that measures the amount of revenue generated for every dollar spent on advertising. The formula is straightforward:
ROAS = Total Ad Revenue / Total Ad Spend
If you spend $1,000 on ads and generate $4,000 in sales, your ROAS is 4.0x. Media buyers love this metric because it provides immediate feedback on campaign performance. It is easy to calculate, heavily prominently featured in ad platforms, and simple to communicate to stakeholders.
Why High ROAS Can Be Misleading
Despite its popularity, relying on ROAS in a vacuum is a recipe for financial disaster. Here is exactly why high ROAS can be misleading: it completely ignores the costs required to produce, package, and deliver your product.
Let’s look at a hypothetical scenario to illustrate the pitfalls of ROAS-based optimization.
Imagine you sell a heavy piece of fitness equipment.
- Retail Price: $200
- Cost of Goods Sold (COGS): $120
- Shipping & Handling: $40
- Payment Processing Fees: $6
Your total costs before advertising are $166. This leaves you with $34 to acquire a customer and make a profit.
Now, imagine your ad campaign generates sales at a $40 Customer Acquisition Cost (CAC). Your ROAS looks fantastic: $200 (Revenue) / $40 (Ad Spend) = 5.0x ROAS.
Most media buyers would scale a 5x ROAS campaign aggressively. But let’s do the math: You make $200, but your product costs ($166) plus your ad spend ($40) equals $206. For every item you sell at a 5x ROAS, you are losing $6. If you scale this campaign, you will literally scale your business into bankruptcy.
This is the fundamental flaw of looking at revenue without looking at costs. To fix this, we must introduce the hero of profitability: the contribution margin.
2. Decoding Contribution Margin
What is Contribution Margin?
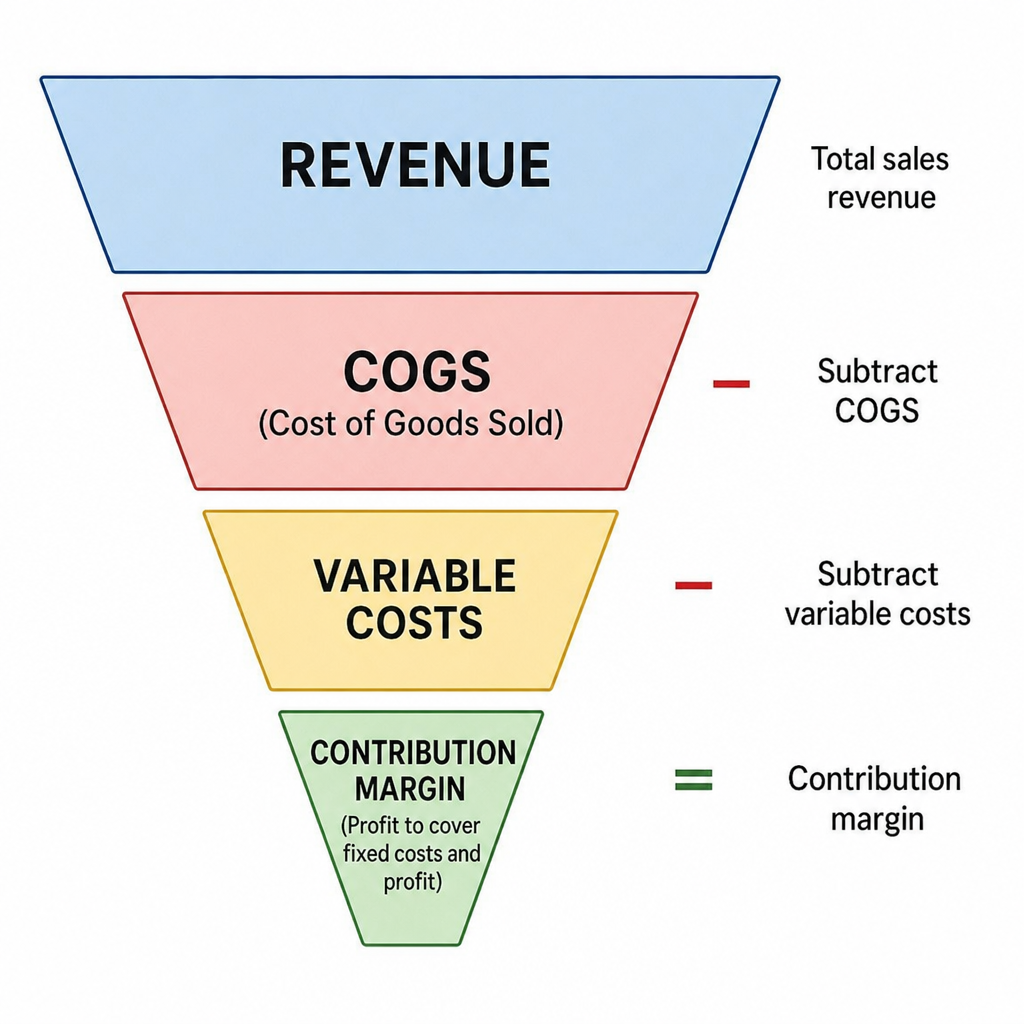
Contribution margin is the revenue remaining from a sale after all variable costs associated with that sale have been deducted. It represents the actual amount of money a specific product “contributes” to paying off your fixed business expenses (like rent, salaries, and software subscriptions) and ultimately, generating a net profit.
Unlike ROAS, which only looks at top-line revenue, contribution margin requires a rigorous cost analysis.
Fixed vs Variable Expenses in E-commerce
To accurately calculate your contribution margin, you must understand the difference between fixed vs variable expenses in e-commerce.
- Fixed Costs: These are expenses that remain constant regardless of how many units you sell. Examples include warehouse rent, employee salaries, Shopify/website hosting fees, and insurance.
- Variable Costs: These are expenses that fluctuate directly with the volume of sales. If you sell zero items, these costs are zero. Examples include Cost of Goods Sold (COGS), pick-and-pack fees, shipping materials, outbound shipping costs, payment gateway percentages, and return processing fees.
The Role of Variable Cost Deduction in Marketing
Proper variable cost deduction in marketing means that before you even consider your advertising budget, you strip away every single variable cost from the retail price. What is left over is your Contribution Margin ($).
When expressed as a percentage, it is the Contribution Margin Ratio: (Revenue – Variable Costs) / Revenue = Contribution Margin %
ROAS vs Gross Profit Margin vs Contribution Margin
It is crucial not to confuse these three terms.
- ROAS: Measures revenue against ad spend.
- Gross Profit Margin: Measures revenue against the pure Cost of Goods Sold (COGS).
- Contribution Margin: Measures revenue against all variable costs (COGS + shipping + processing + fulfillment).
When comparing ROAS vs gross profit margin, marketers often realize that gross margin isn’t enough either, because it ignores the heavy toll of shipping and fulfillment. Contribution margin is the only metric that gives you the true, fully-burdened profit potential of a product before ad spend.
3. The Showdown: Contribution Margin vs. ROAS
When analyzing contribution margin vs. ROAS, you are essentially looking at the difference between a top-line growth metric and a bottom-line health metric. Let’s break down the core differences.
The debate of contribution margin vs roas isn’t about eliminating ROAS entirely. ROAS is still a highly useful diagnostic tool for media buyers. If Campaign A has a 3x ROAS and Campaign B has a 1x ROAS, Campaign A is clearly resonating better with the audience.
However, ROAS should never be the goal. The goal must always be maximizing contribution dollars. When you optimize purely for ROAS, algorithms tend to favor cheap, low-margin products or returning customers (who already know your brand), inflating the platform numbers without adding real financial value to your business.
By shifting to a contribution margin marketing strategy, you dictate terms to the ad platforms based on what makes your business money, rather than letting the platforms dictate success based on inflated revenue numbers.
4. Building Your E-commerce Unit Economics Framework
To stop flying blind, you must establish a strict e-commerce unit economics framework. Unit economics is the direct revenues and costs associated with a particular business model, measured on a per-unit basis.
If your unit economics are broken, no amount of brilliant marketing, viral TikToks, or high-ROAS campaigns will save you. In fact, scaling a business with negative unit economics just burns cash faster.
The Net Profit Per Order Calculation
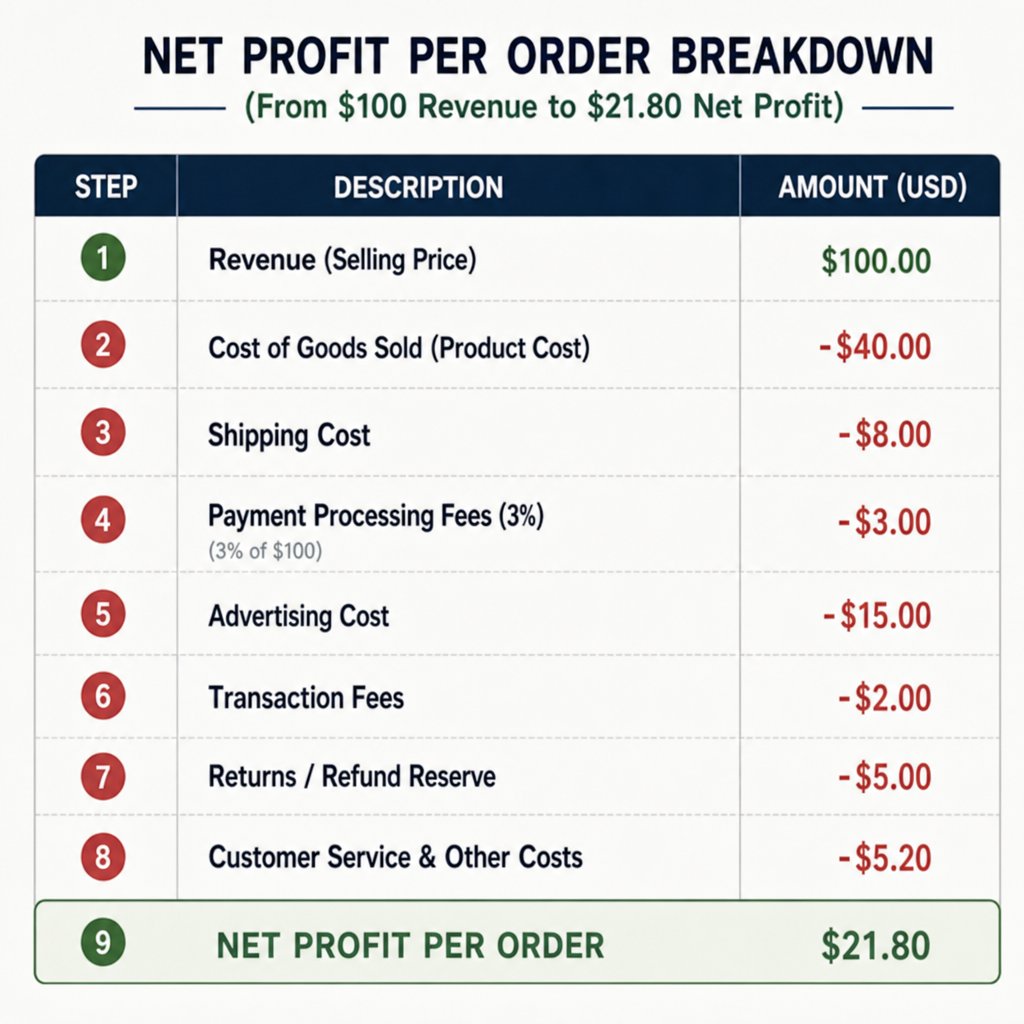
Let’s walk through a comprehensive net profit per order calculation. This is the exact framework profitable DTC (Direct-to-Consumer) brands use daily.
Step 1: Gross Revenue
- Customer pays: $100.00
Step 2: Subtract COGS (Cost of Goods Sold)
- Product manufacturing cost: $25.00
- Freight to warehouse: $3.00
- Remaining: $72.00
Step 3: Subtract Fulfillment & Shipping (Variable Costs)
- Pick and pack fee: $2.50
- Packaging materials: $1.00
- Outbound shipping: $8.50
- Remaining: $60.00
Step 4: Subtract Transaction & Operational Fees
- Payment gateway (e.g., Stripe/Shopify at 2.9% + $0.30): $3.20
- Expected return rate allowance (e.g., 5% of order value): $5.00
- Remaining (Contribution Margin before Ad Spend): $51.80
In this framework, your Contribution Margin is $51.80 (or 51.8%). This is the absolute maximum you can spend to acquire a customer (CAC) to break even on the first order.
Step 5: Subtract Customer Acquisition Cost (CAC)
- Cost to acquire this customer via Meta ads: $30.00
Final Result: Net Contribution Profit per Order
- $51.80 – $30.00 = $21.80
This framework makes the relationship between customer acquisition cost vs contribution margin crystal clear. If your CAC is higher than your Contribution Margin, you lose money on the first purchase. If your CAC is lower, you make money.
5. The Math That Matters: Calculations for Success
Understanding the theory is great, but applying the math is where businesses transform. Let’s look at the actionable calculations you need to run your ads profitably.
How to Calculate Contribution Margin for Ads
When you evaluate an ad campaign, you need to know exactly how much profit it is generating. Here is how to calculate contribution margin for ads at a campaign level:
- Take the total revenue generated by the campaign (e.g., $10,000).
- Determine the blended variable cost percentage for the products sold (e.g., if your variable costs usually eat up 40% of revenue, your variable cost deduction is $4,000).
- Calculate the raw Contribution Margin: $10,000 – $4,000 = $6,000.
- Subtract the campaign ad spend (e.g., $3,000).
- Campaign Contribution Profit: $6,000 – $3,000 = $3,000.
In this scenario, your campaign brought in $3,000 of actual, usable cash to the business.
The Break-Even ROAS Calculation
This is arguably the most important metric a media buyer can know. Your Break-Even ROAS tells you the exact ROAS number you need to hit in the ad account to neither make nor lose money.
The break-even ROAS calculation is simple once you know your Contribution Margin percentage:
Break-Even ROAS = 1 / Contribution Margin Ratio
Let’s look at examples based on different margin profiles:
High Margin Business: Selling digital products or cosmetics.
- Contribution Margin: 80% (0.80)
- 1 / 0.80 = 1.25x Break-Even ROAS
- Takeaway: This business can afford to be incredibly aggressive. As long as the ad platform shows a ROAS above 1.25, they are printing profit.
Average E-commerce Business: Selling apparel or consumer goods.
- Contribution Margin: 50% (0.50)
- 1 / 0.50 = 2.0x Break-Even ROAS
Low Margin Business: Selling electronics, heavy items, or dropshipping.
- Contribution Margin: 20% (0.20)
- 1 / 0.20 = 5.0x Break-Even ROAS
- Takeaway: This is why dropshippers often struggle to scale. If their platform ROAS drops to 4.5x, they are actively bleeding cash, even though 4.5x sounds amazing to an outsider.
Knowing your break-even ROAS empowers you to optimizing for bottom-line profitability rather than blindly chasing a 3x or 4x platform benchmark that may not actually suit your specific business model.
6. Shifting to a Contribution Margin Marketing Strategy
Knowing the numbers is only half the battle. The real challenge is changing how you execute your marketing. Adopting a contribution margin marketing strategy means changing your targets, adjusting your creative, and realigning your media buying team.
1. Segment Campaigns by Margin, Not Just Product Category
Most ad accounts group products by category (e.g., “Men’s Shirts” vs. “Men’s Pants”). A profit-focused marketer groups products by margin profile.
If you put a high-margin product and a low-margin product in the same campaign, the ad platform’s algorithm will push budget toward the item that converts easiest. Often, this is a cheaper, low-margin item. The platform will report a stellar ROAS, but your bank account will suffer. By segmenting campaigns by margin, you apply specific Break-Even ROAS targets to each campaign, ensuring the algorithm optimizes for actual business value.
2. Adjusting Bids Based on True Profitability
When comparing customer acquisition cost vs contribution margin, you dictate your bidding strategy. If you know a specific bundle yields a $70 contribution margin, you can confidently tell your media buyer (or set your target CPA on Meta/Google) to acquire customers for $45. This guarantees a $25 net profit per order.
3. Merchandising for Margin
Marketing isn’t just about ads; it’s about what you offer. If your contribution margin is too low to sustain ad spend, you cannot just “market harder.” You must merchandise smarter.
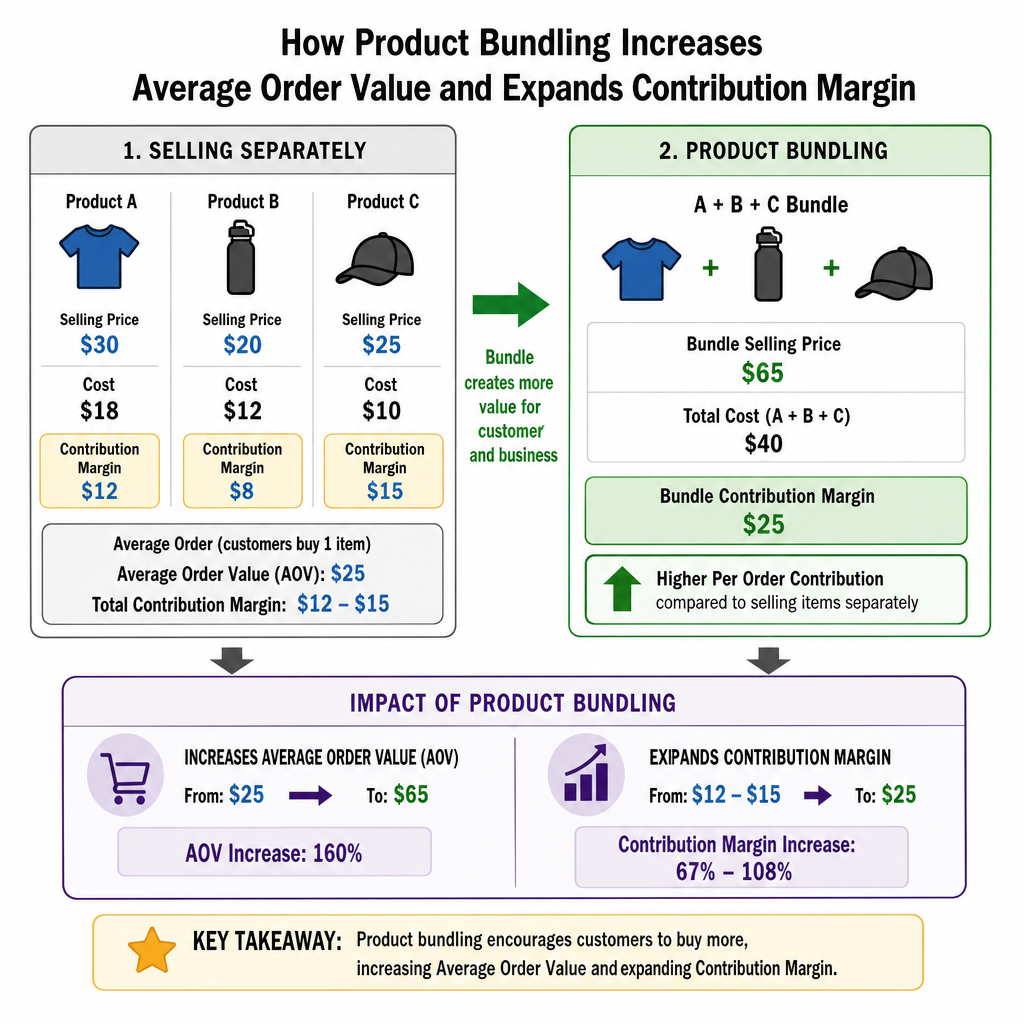
- Create Bundles: Combine high-margin accessories with core products to increase Average Order Value (AOV) without significantly increasing shipping costs.
- Promote Multi-Packs: Selling three of the same item at a slight discount dramatically improves the unit economics because you only pay the fixed acquisition cost and the outbound shipping cost once.
7. Measuring True Impact: Incrementality and MER
If you base your entire contribution margin strategy solely on the ROAS reported inside Facebook Ads Manager or Google Ads, you will still run into trouble. Why? Because ad platforms are notorious for claiming credit for sales they didn’t actually generate.
Marketing Efficiency Ratio (MER) Analysis
To combat attribution overlaps and platform bias, savvy e-commerce operators rely on MER.
Marketing Efficiency Ratio (MER) = Total Business Revenue / Total Advertising Spend
A Marketing Efficiency Ratio analysis provides a macroeconomic view of your business. While ROAS tells you how a specific ad performed (according to the platform), MER tells you how your entire marketing ecosystem is performing.
When you combine MER with contribution margin, you get the “Blended Contribution Margin.” This accounts for organic sales, returning customer sales, and paid acquisitions. It answers the ultimate question: At the end of the day, when all revenue is collected and all bills and ads are paid, how much money did the business make?
Identifying Incremental Profit from Advertising
Not all revenue is created equal. Incremental profit from advertising is the profit generated by sales that would not have occurred without the ad spend.
For example, if you spend heavily on branded search terms (bidding on your own company name), the ad platform might report a 15x ROAS. But did those ads actually generate new sales, or did they just cannibalize organic traffic from people who were already looking for you?
To optimize for true profitability, you must run hold-out tests (turning off ads in specific regions or for specific channels) to see how much total revenue drops. This helps you calculate your incremental ROAS and, by extension, your incremental contribution margin. It ensures you are spending marketing dollars to acquire net-new revenue, rather than paying platforms a tax on organic sales.
8. Scaling Profitable Ad Campaigns
Scaling an ad account is the ultimate test of your e-commerce unit economics framework. It is very easy to be profitable at $100 a day in ad spend. It is exponentially harder to remain profitable at $5,000 a day.
The Dynamics of Scaling
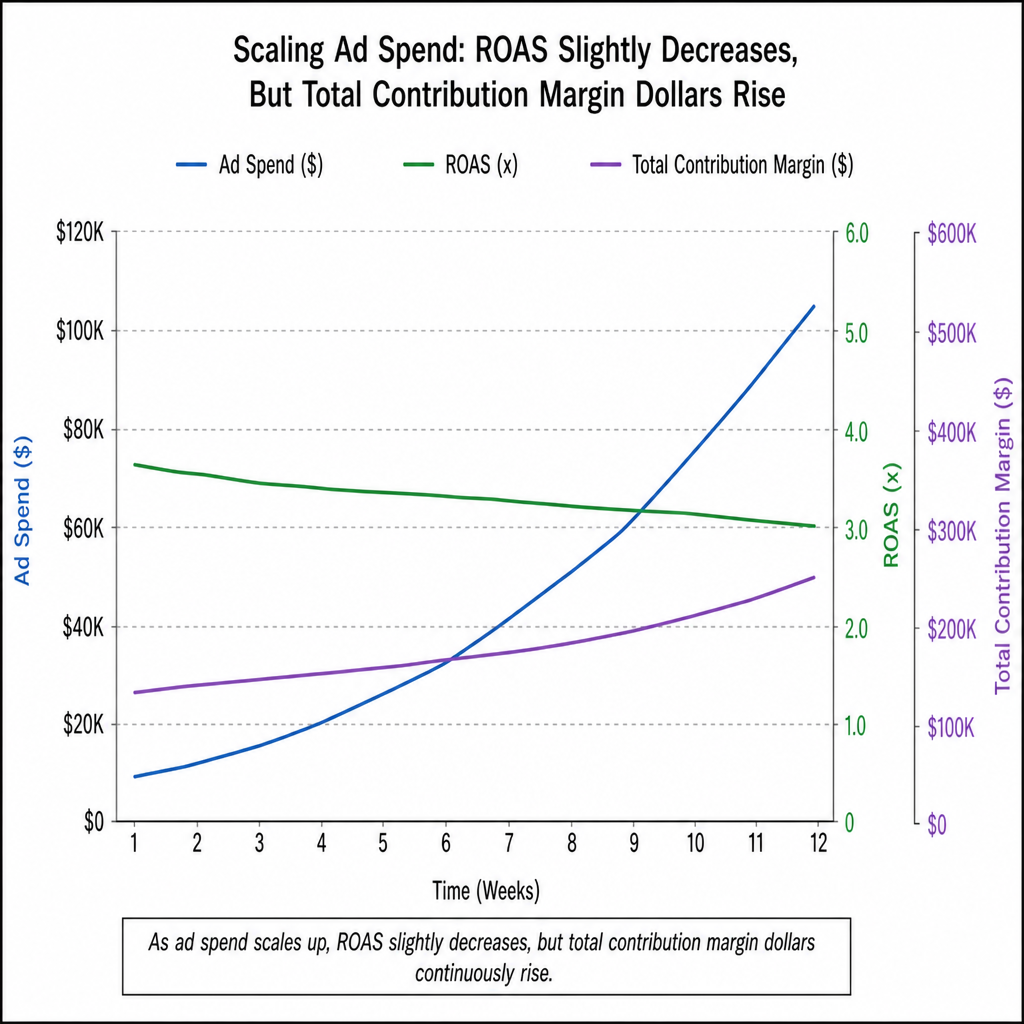
As you scale ad spend, you are forced to reach broader, less-qualified audiences. Invariably, your conversion rates will drop slightly, and your Customer Acquisition Cost (CAC) will rise. Consequently, your ROAS and your contribution margin will compress.
This is where the pitfalls of ROAS-based optimization usually destroy scaling efforts. If you stubbornly demand a 3x ROAS while scaling, the algorithm will eventually stop spending your budget because it cannot find enough cheap conversions.
How to Scale Without Bleeding Cash
1. Focus on Contribution Dollars, Not Percentages Would you rather have a 50% margin on $10,000 in sales ($5,000 profit) or a 20% margin on $100,000 in sales ($20,000 profit)?
When scaling profitable ad campaigns, you must accept margin compression. As your CAC rises, your percentage margin drops, but your total absolute contribution dollars should increase. As long as your CAC remains below your Contribution Margin, every new order is adding cash to the bank.
2. Establish a “Scale” Break-Even Point Before scaling, recalculate your net profit per order calculation factoring in the expected rise in CAC. Set clear rules for your media buyers: “Scale budget by 20% every 3 days as long as our Blended Contribution Margin remains above $15 per order.” This keeps the team focused on optimizing for bottom-line profitability rather than pausing campaigns just because ROAS dipped slightly.
3. Leverage LTV (Lifetime Value) in Your Cost Analysis If your business has a high repeat purchase rate (like supplements, skincare, or coffee), you can afford to break even—or even lose a little money—on the first order.
If your First-Order Contribution Margin is $0, but you know historically that 40% of customers buy again within 60 days with zero ad spend, your 60-day Contribution Margin is highly profitable. This advanced cost analysis allows you to outbid competitors who are strictly optimizing for immediate ROAS.
9. Common Mistakes in Margin-Based Marketing
Transitioning from a ROAS mindset to a Contribution Margin mindset takes time, and there are several traps marketers fall into during the process.
- Ignoring Return Rates: If you calculate your margin based on shipped orders but fail to deduct the cost of returns, your margin is a phantom. Always include an estimated return percentage in your variable cost deduction in marketing.
- Static COGS Tracking: Supplier costs fluctuate. Freight costs fluctuate. If you are calculating your break-even ROAS based on COGS from two years ago, your math is completely invalid. Update your unit economics framework quarterly.
- Siloed Teams: The biggest barrier to optimizing for bottom-line profitability is organizational structure. If the finance team holds the margin data and the marketing team only looks at platform ROAS, failure is inevitable. Transparent dashboards that merge Shopify/ERP data with ad platform spend are essential. Tools like Triple Whale, Northbeam, or even a robust custom spreadsheet can bridge this gap.
Conclusion
The debate between contribution margin vs. ROAS is ultimately a debate about the maturity of a business. ROAS is the metric of early-stage growth—it is exciting, visible, and easy to grasp. But contribution margin is the metric of sustainable, long-term success. It is the uncompromising truth of your financial health.
By building a meticulous e-commerce unit economics framework, mastering your break-even ROAS calculation, and insisting on optimizing for bottom-line profitability, you protect your business from the volatility of ad platforms.
You stop chasing vanity metrics and start accumulating actual cash.
The next time you log into your ad dashboard and see a glowing ROAS, take a moment to celebrate. But then, open your margin calculator, run your net profit per order calculation, and verify that those green numbers are actually translating into money in the bank. Because in the world of e-commerce, revenue is vanity, ROAS is an indicator, but contribution margin is sanity.
